Friday, March 1, 2019

Dodeca Commentary Part Two


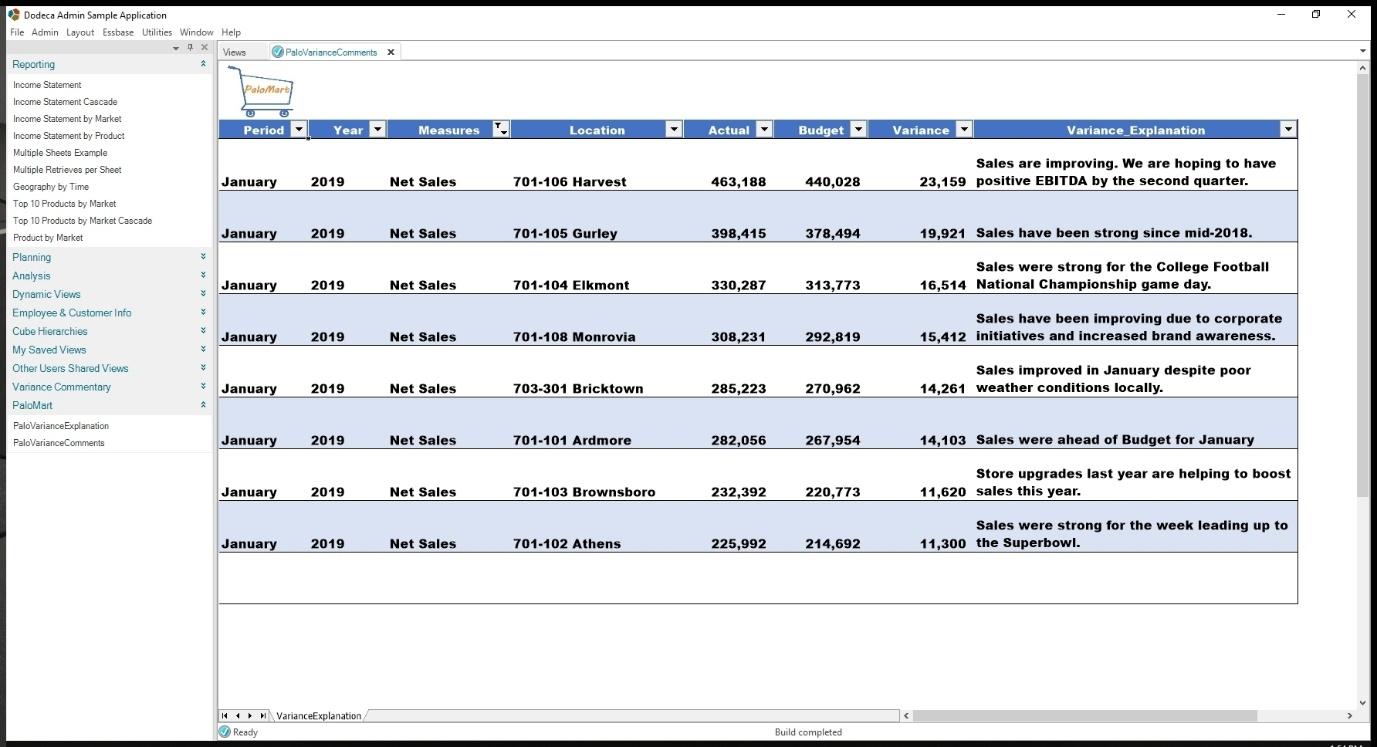
This post is part two of three in a series on using commentary in Dodeca. In this post I will be showing how to set up a view that shows all the comments entered for an Essbase cube.


This report combines Essbase and relational data so I set it up as an Essbase Excel View.
image


The template is fairly straight forward.
 
I added a cell that will contain my ConnectionID as well as the scenarios I will use to retrieve Essbase data.
image
I set up four named ranges.
 
One range will define the column that will contain the comments.
 
The next range will tell Dodeca where the Essbase retrieve range will begine.
 
The Header.Row.1 range defines where the Essbase scenarios will be stored.
 
The SQL.DataRange.1 will tell Dodeca where to bring in the relational data.
image


In order to get the zebra striping on this report, I did export the template to Excel. I set up a conditional formatting rule to handle it. In this case I used the ISODD() and ISEVEN() Excel functions along with the ROW() function. This is a simple way to add this type of formatting to a view. Once I had set this conditional formatting up, I imported the template in Dodeca.


Next I created a SQL Passthrough Dataset and defined one query to bring back the comments.
image
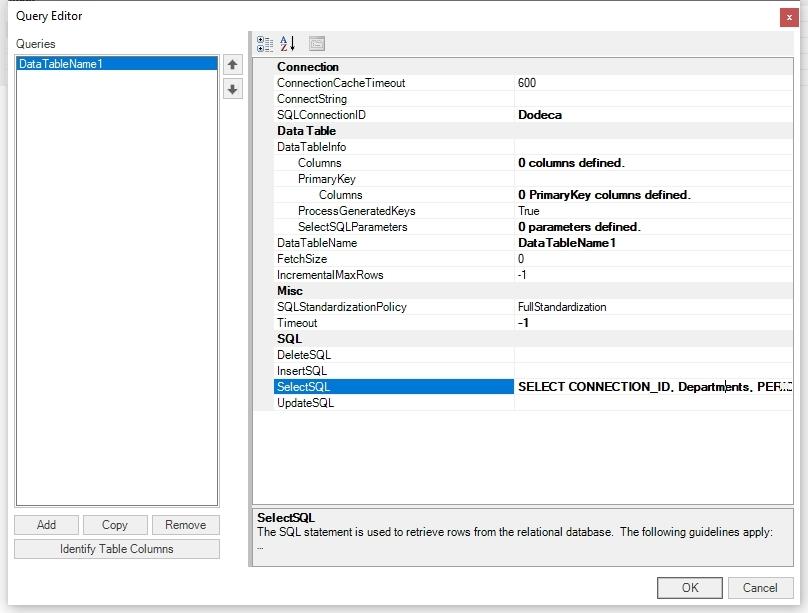
The query I set up will only perform a Select statement.
image
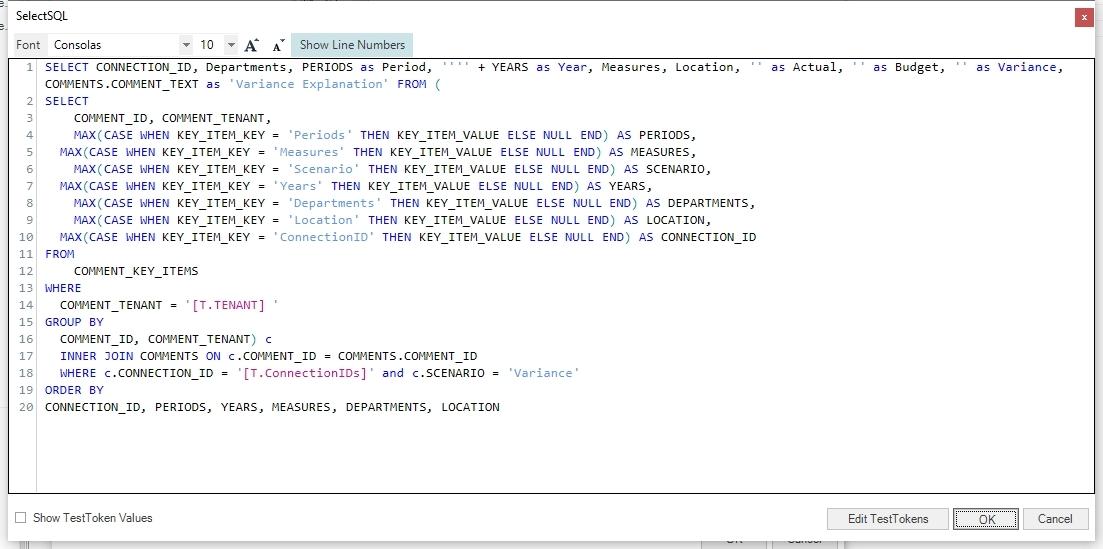
This is the SQL used to bring back all the comments in the current Tenant with the ConnectionID for the cube.
 
This SQL is a bit tricky since each Key,Value pair in the Comment_Key_Items table is stored as a row. Essentially the rows need to be pivoted to the columns -- something not very straightforward in SQL.
 
If you do end up trying to reproduce this view in Dodeca and have trouble writing the SQL, drop me a note in the comments and I'll be glad to give you a hand with your specific dimensionality. There are several ways to write the SQL -- this is just one of many.
 
I added ConnectionIDs as a Key,Value pair just in case the dimensionality in this cube is the same as another cube using commentary. This practice will help to avoid any unintended conflicts.
image


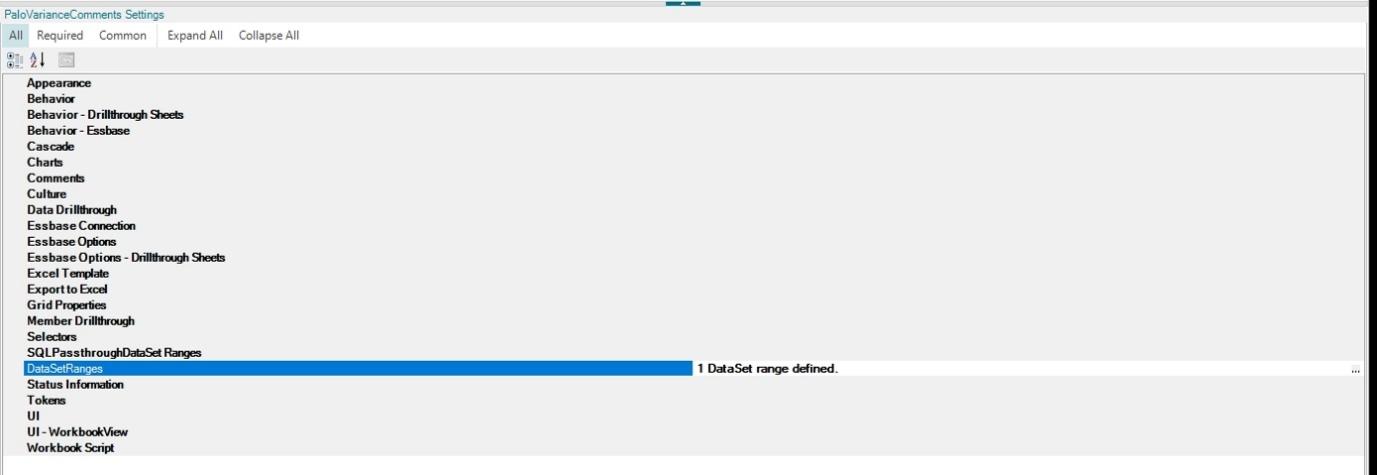
The only view property of note in this case is DataSetRanges.
image
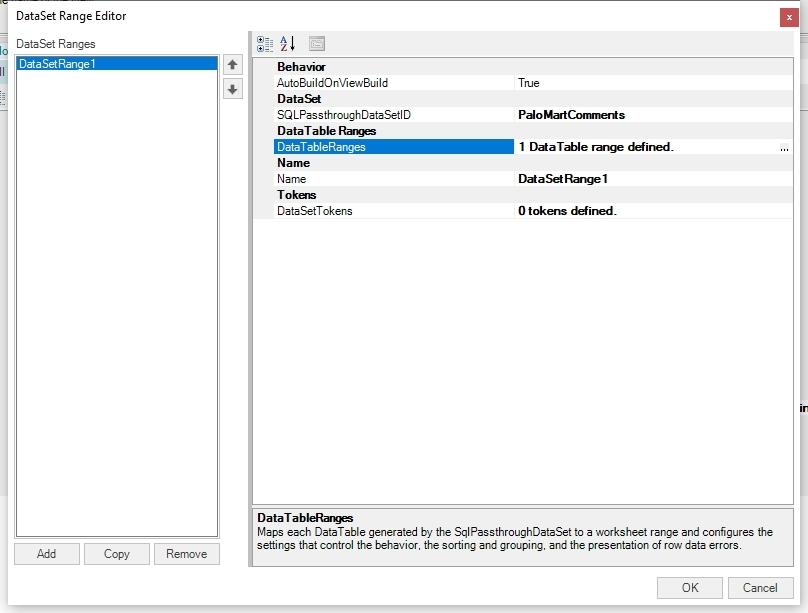
I set the SQLPassthroughDataSetID to PaloMartComments which I created in the prior step.
image
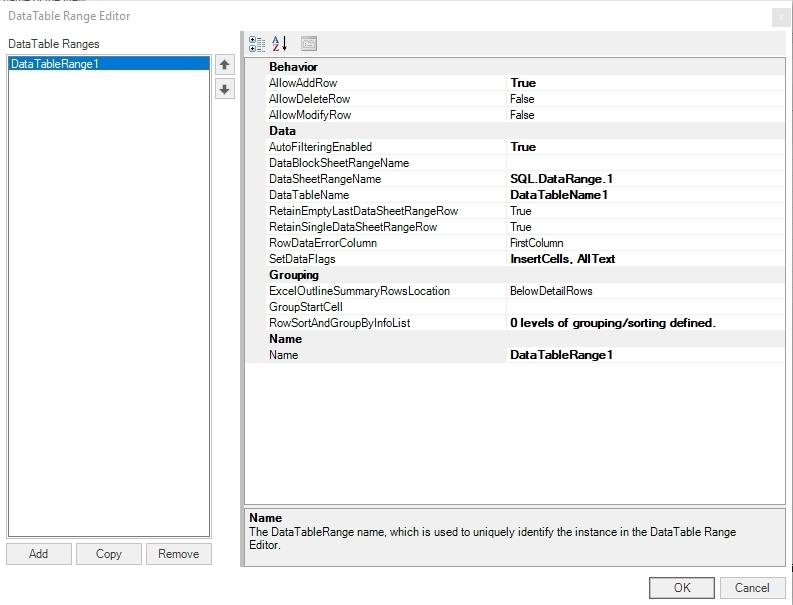
In the DataTable Range Editor I turned on AutoFiltering which will allow us to sort and filter on any of the fields in the view.
 
I also changed SetDataFlags to InsertCells, AllText. This will expand the named range when the SQL data is returned. So any formatting will be copied throughout the range.
image
Next I set two properties.
 
The first I called OpenedFromPaloVarianceComments. I'll use this in the next post when I create the adhoc sheet based upon a double-click. I set that value to true and allowed it to be shared between views.
 
The next I called IsDoneBuilding. I set this to false. I will use this to handle unwanted Essbase retrieves after the initial pull of data.

image
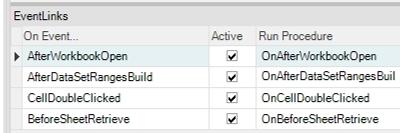
I ended up creating procedures that run upon four different Events being fired. I'll discuss all but the CellDoubleClicked. I'll handle that in part three of this series.
image


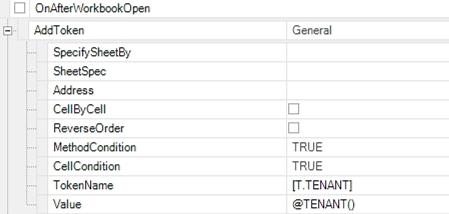
I used the AfterWorkbookOpen event to add a couple of tokens to the view.

image


I added one token for the Tenant. This was used when I set up the SQL query.
image


I also added a token for the ConnectionID. This was used in the SQL query and was placed on the sheet.
image
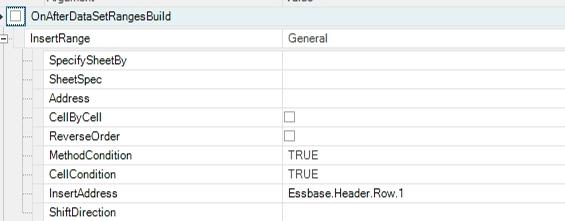
The first method in the OnAfterDataSetRangesBuild procedure is InsertRange. This will add a row at the top of the returned comments. This procedure gets called after the SQL query is run and the data is placed on the sheet.
image


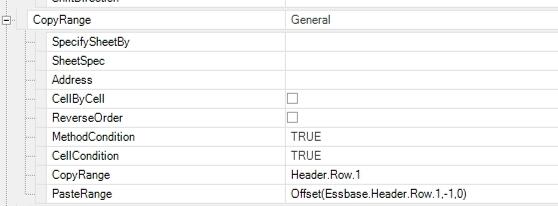
The next method is CopyRange. I used this to copy in our Header.Row.1 named range to the empty line I just added. This will copy in our Essbase scenarios.
Once this is complete, we now have a well formed Essbase retrieval range with five of the dimensions in the rows and the Scenario dimension in the columns.
image


Now that we have a well formed Essbase retrieval range, we can create the defined range name by using the AddDefinedName method. In this case I'm using the Offset function along with the SQL.DataRange.1 named range to create the new range.
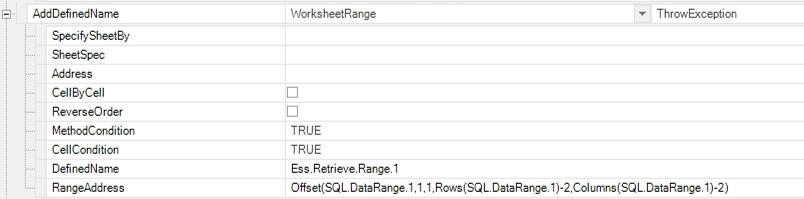
image
Once I had created an Essbase retrieve range all I had to do was perform the EssbaseRetrieve method using a RetrievePolicy of RetrieveRanges to get my data back.
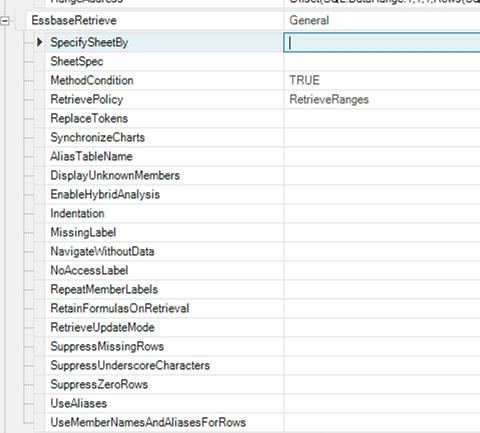
image


In this view I only needed the scenario names at the top of my sheet for the Essbase retrieve. Once that was done, I no longer needed them. Hiding them wasn't a great option since they could possibly be unhidden during a sort or filter change. Deleting them was the easiest way to remove them.
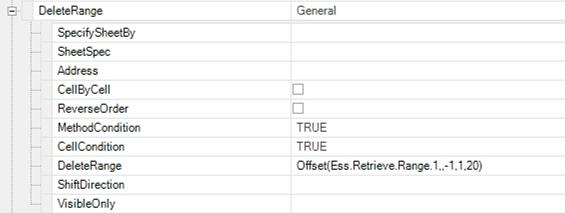
image
Next I set the row height so multiple lines of comments were visible. I decided to show three lines of comments for this report.
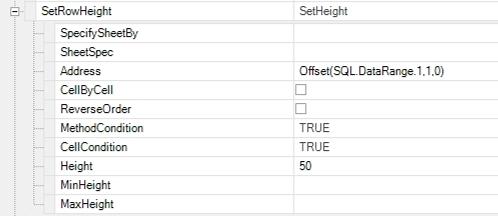
image


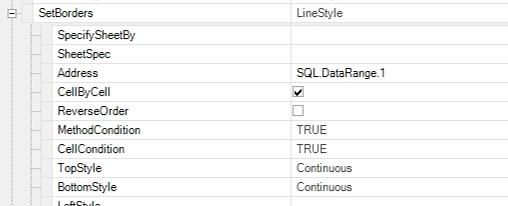
Next I added some borders to make things a little easier to read.
image


And some more borders.
image
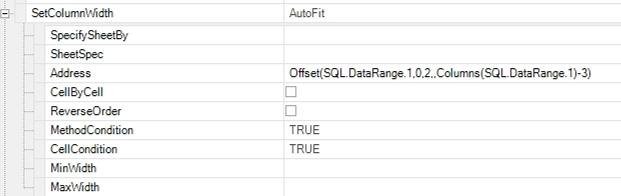
Next I set column widths to autofit the SQL.DataRange less a few hidden columns.
image


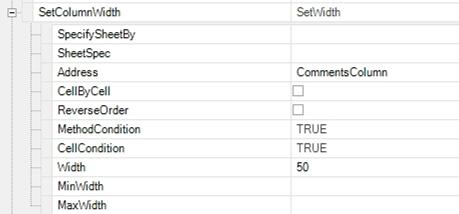
I wanted to make the comments column a bit wider so I added another SetColumnWidth method.
image


I wasn't happy with the way autofit handled some of the columns. It looks like the filter down-arrows don't count when it does the fitting. So I used the @ColWidth Dodeca function to increase each field by '4' which made the sheet look much cleaner and all headers readable. I also only ran the method on cells with a ColWidth not zero. That eliminated any hidden rows from being expanded.
image
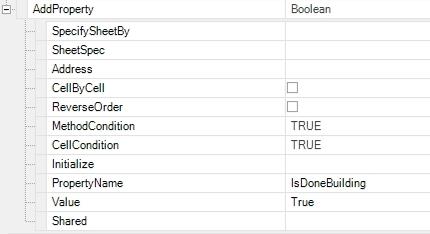
Next I set the IsDoneBuilding property to true. No data needs to be retrieved after the initial build on this view. So I'll use this to cancel the BeforeSheetRetrieve event.
image


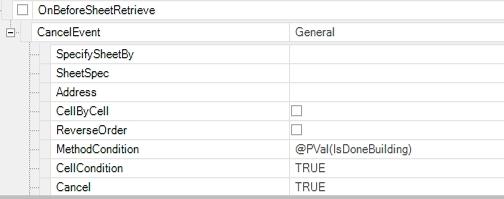
Finally, I created the OnBeforeSheetRetrieve procedure to check if the view is done building. If it is done, I cancel the event. I use the @PVal Dodeca function to check the IsDoneBuilding property value. Adding this method stops the view from updating unnecessarily. After the initial build, the only thing a user can do is sort and filter the data.
 
image


In the next step, I'll show how to use the double-click event to take the user to an adhoc sheet.


Friday, February 22, 2019

Dodeca Commentary Part One


This post is part one of three in a series on using commentary in Dodeca. In this post I will be showing how to set up a simple view that allows user comments.
image


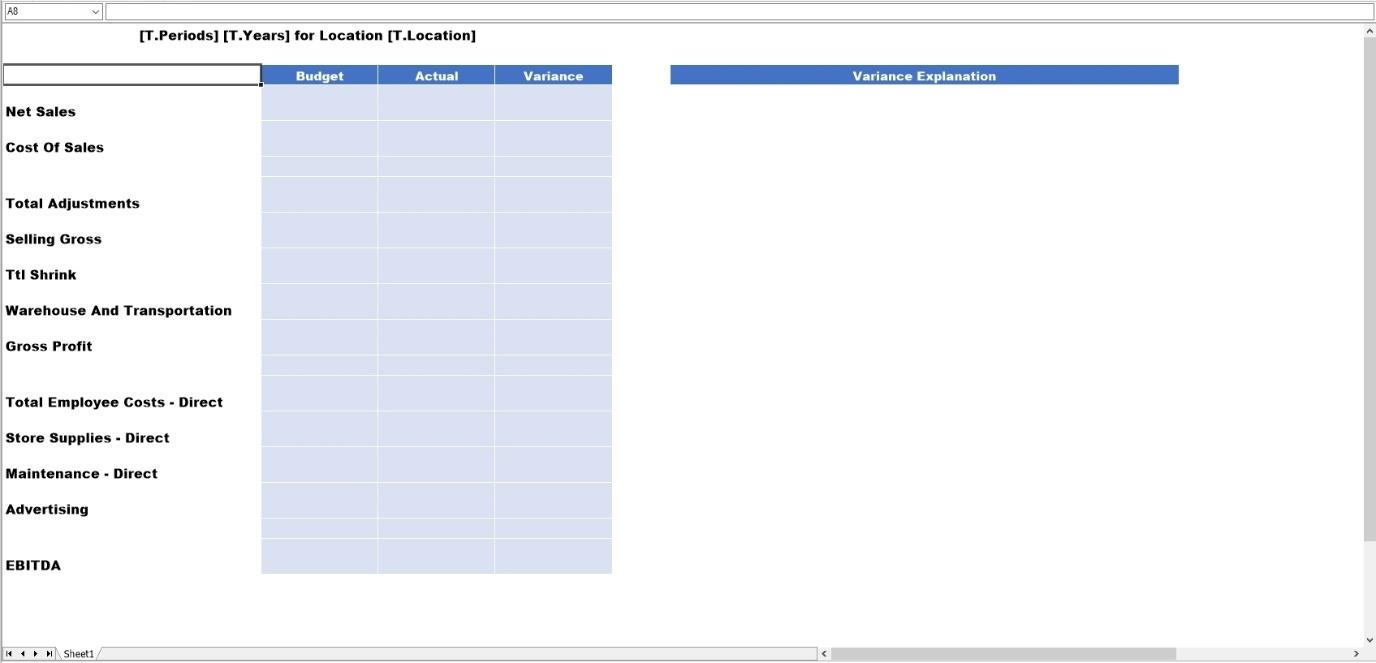
First I set up the view template to include an Essbase retrieve range.
 
I then added a column for users to enter their comments. I chose Column F for this example.
image


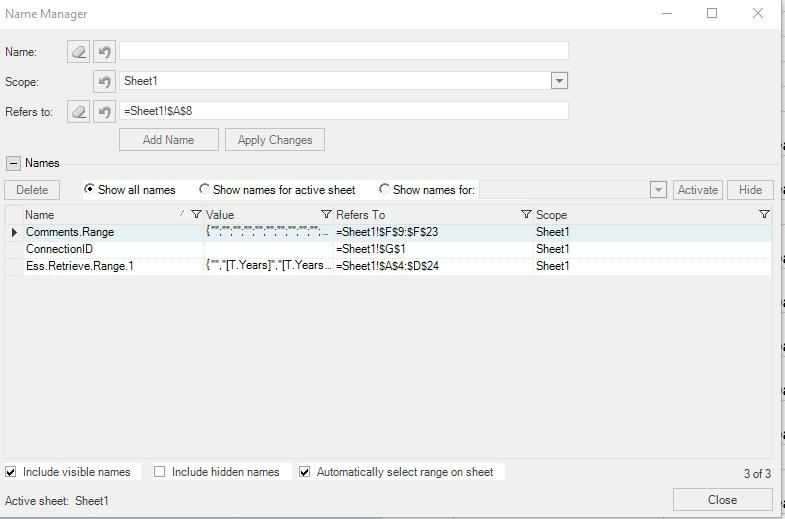
Next I created three named ranges in the template.
 
Comments.Range is the area in which users will enter their comments.
 
ConnectionID will hold the ConnectionID for the view and will be hidden from the end user.
 
Ess.Retrieve.Range.1 is the range into which Essbase data will be retrieved.
image


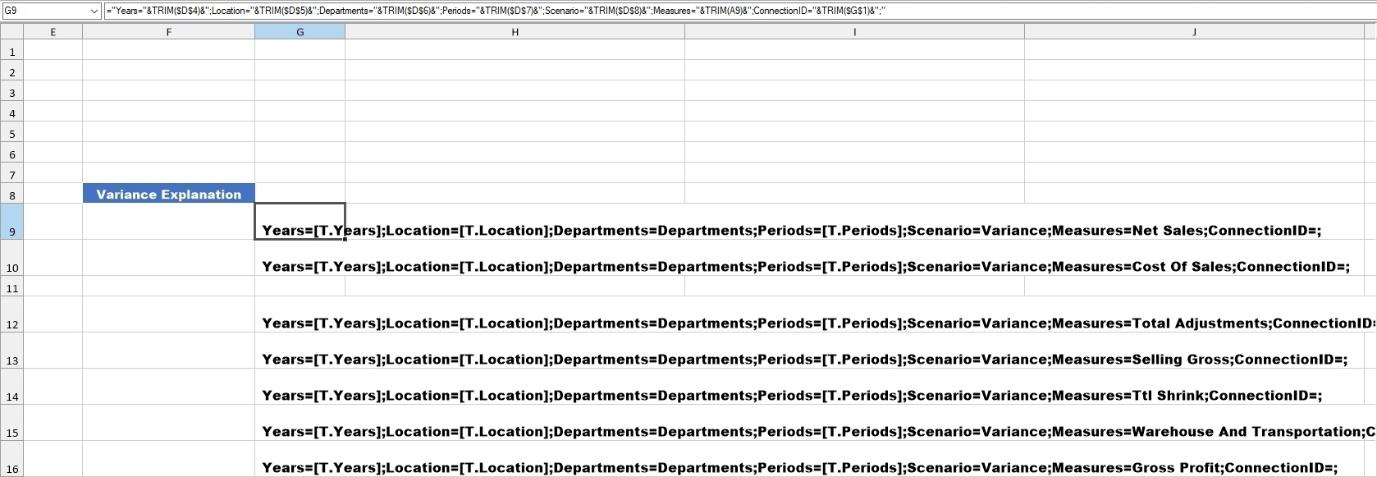
The next part involves writing an Excel formula so that Dodeca knows how the commentary data should be stored in the repository.
 
Dodeca uses Key,Value pairs in order to store the comments.
 
For example, "Years" would be a key while "2019" would be the value. You can add as many or few Key,Value pairs together as you want to represent a single comment. In this case I'm going to add a Key,Value pair for each dimension in addition a Key,Value pair for my view's ConnectionID. That way comments from this cube will not interfere with comments from another cube if the dimensionality is identical.

The string related to Years for 2019 should look like this:
Years=2019;

This Key,Value pair will be concatenated to the rest of the Key,Value pairs that make up an entry. The semi-colon is used as a delimiter.
 
image


That formula is pasted into cell G9 and copied down the sheet. The formula will pick up the correct value for each key from the view.
 
Column G will eventually be hidden from the user. The user needs no understanding of how Dodeca manages comments.
image


Next I hid rows and columns, headings and gridlines.
image


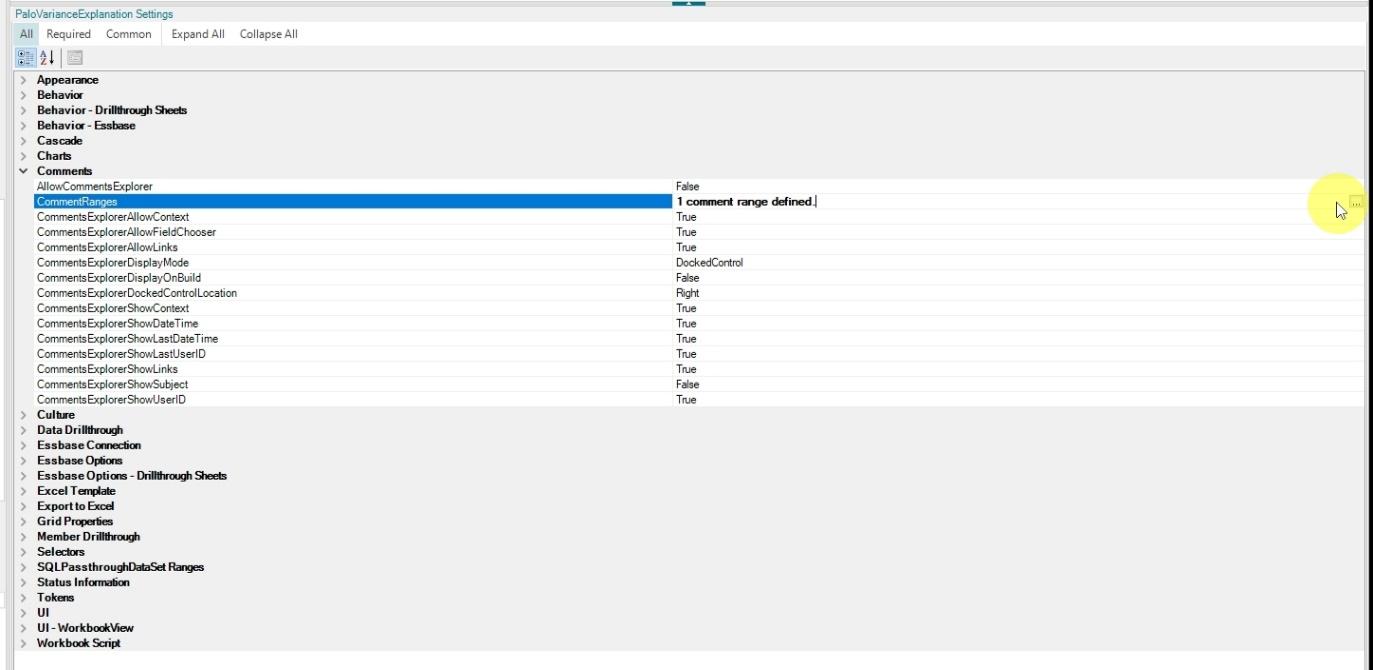
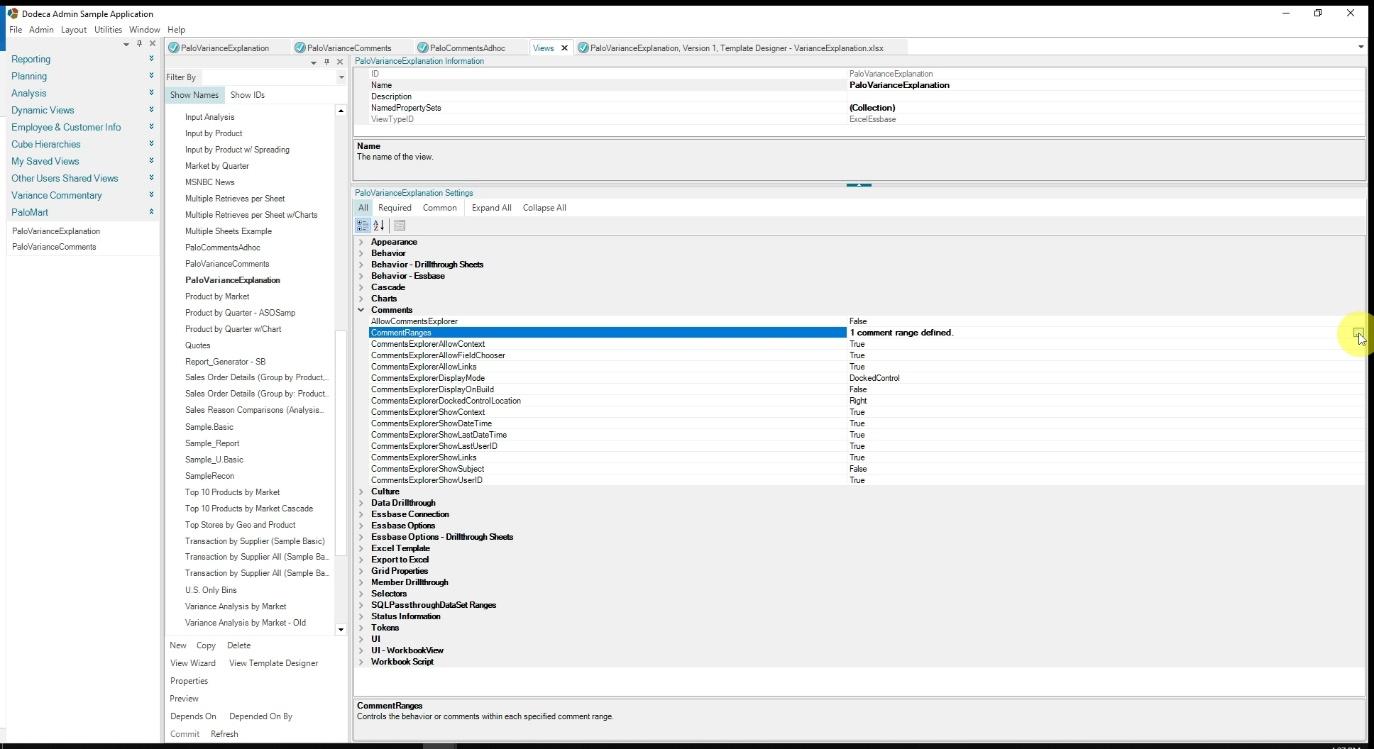
In my view properties, I selected the ellipses on the CommentRanges property.
image


image


Next I clicked "Add".
 
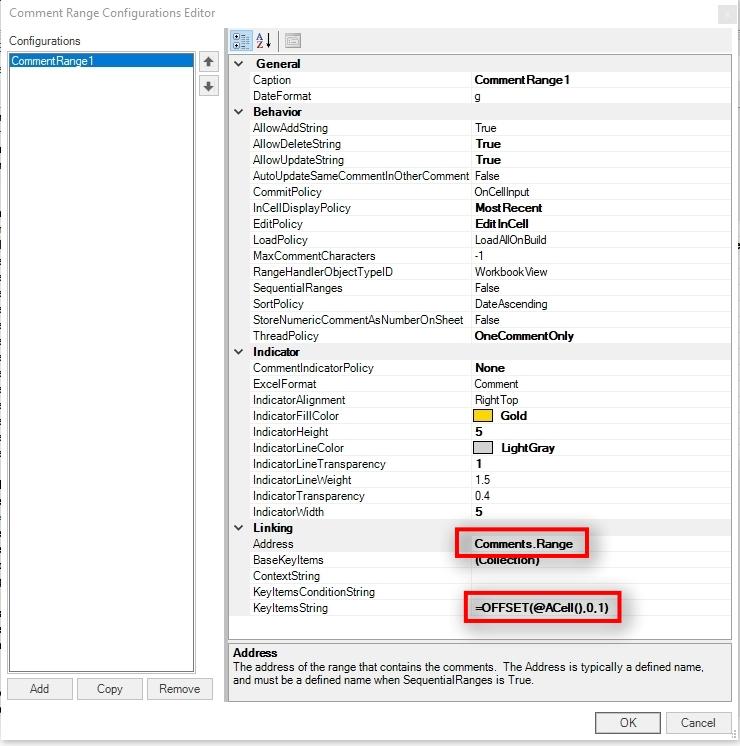
Then I set various properties for my comment range. Notice the properties in bold have been changed from the default value.
 
Note two critical properties on this screen. The first is Address. This is where I entered the named range from my view template. This is the range in which the user will be entering their comments.
The next critical property is KeyItemsString. This tells Dodeca where to look for the Key,Value pair string related to a given comment. In this case I'm using the Offset() Excel function to find the cell immediate the right.
 
 
image


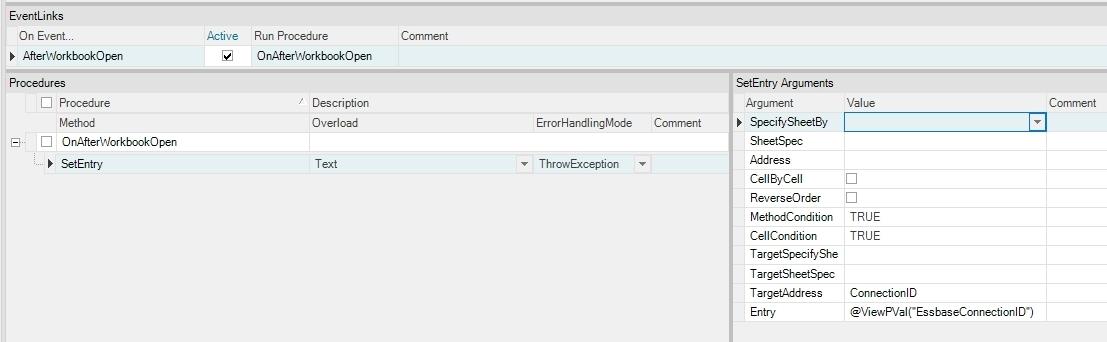
Finally, I did add one method in a Workbook Script. This handled putting the ConnectionID on the view so it could be used in a Key,Value Pair.
I added the @ViewPVal("EssbaseConnectionID") function in the SetEntry method. It populates the ConnectionID named range I set up in an earlier step.
image


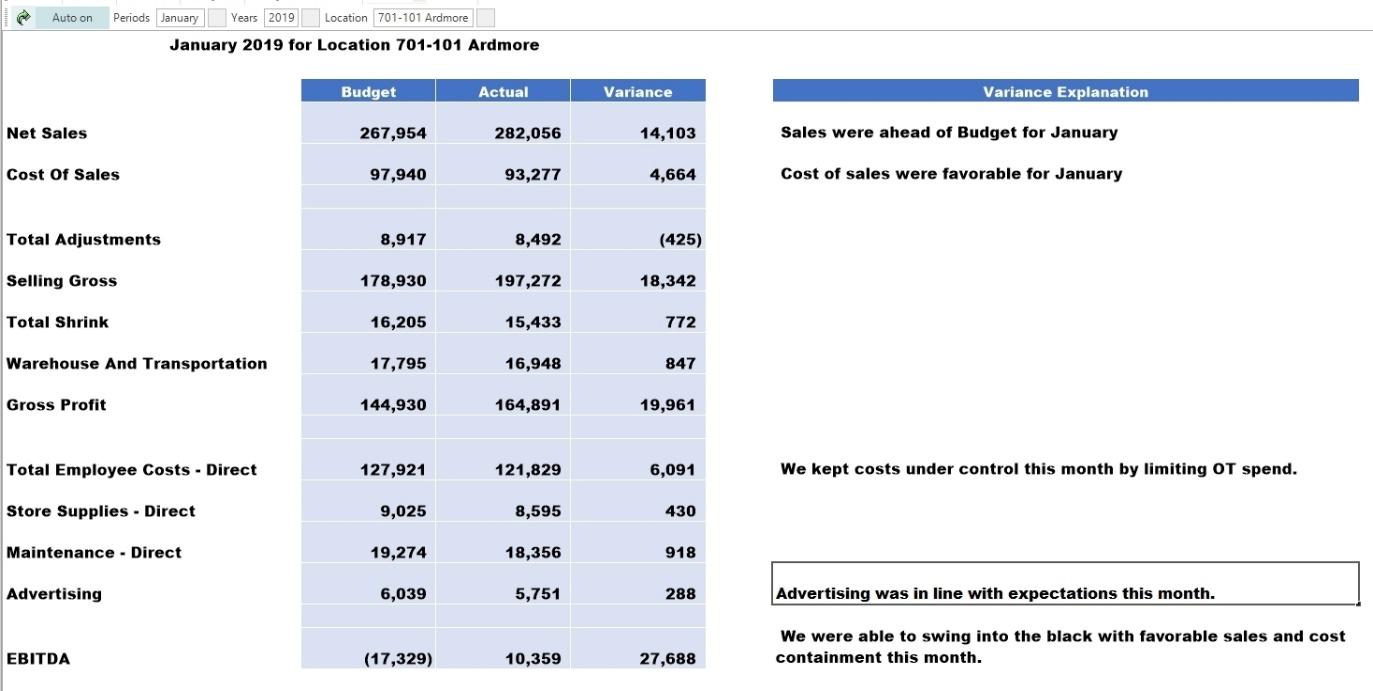
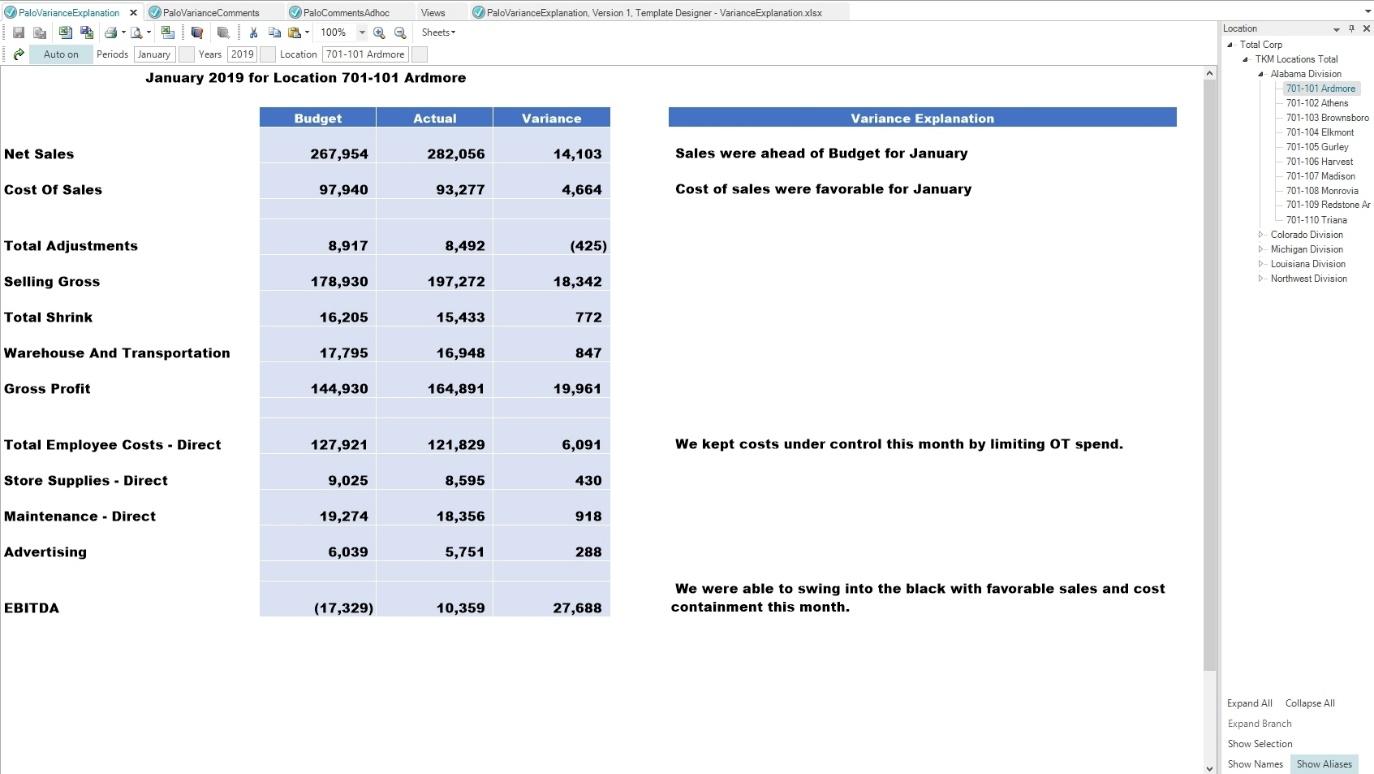
Now when I run the view, I can enter comments in the Variance Explanation column. Once I type a comment and press enter, the comment is immediately saved to the Dodeca repository.
 
In Part Two, I will show how to create a view that shows all the comments for a cube on a single screen.
image

Wednesday, February 13, 2019

Store Reorganization using Dodeca


The idea behind this report is that a company is growing quickly and a new division must be created. This report was originally created by Michael McLaughlin. You should visit is excellent Dodeca Blog. I've taken his original report and made it completely dynamic and solely using MDX to return data. There are no sheet formulas or Essbase Retrieve Ranges. As with most things in Dodeca, there are several ways to accomplish the same task. This is merely an exercise to show the power of using MDX.
image


The outline is shown here with emphasis on the Location dimension. We'll use this dimension to allow the user to rearrange the divisions.
image


The first step is to set up the selectors. I created selectors for Departments, Location, Measures, Periods and Scenario.
image


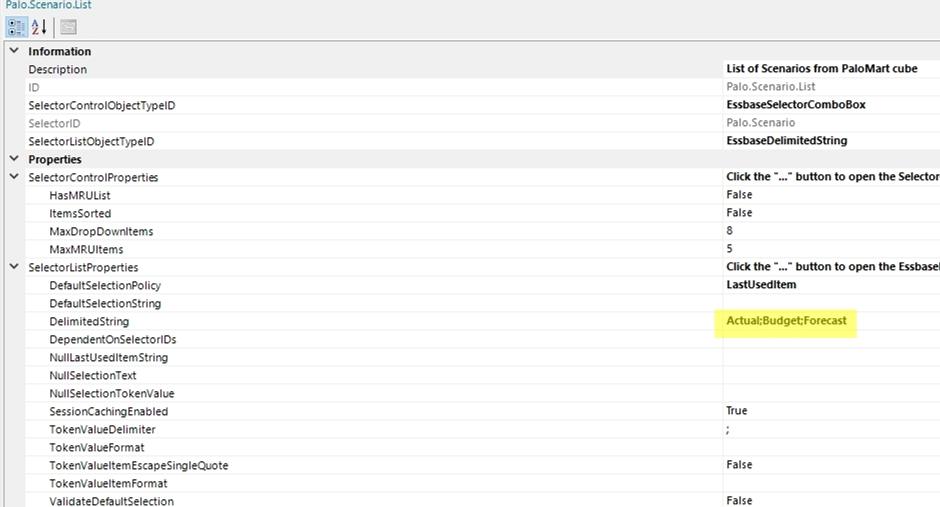
Then I created the Selector Lists. Most of them are straightforward. For the Scenario dimension I allow users to select Actual, Budget or Forecast.
image


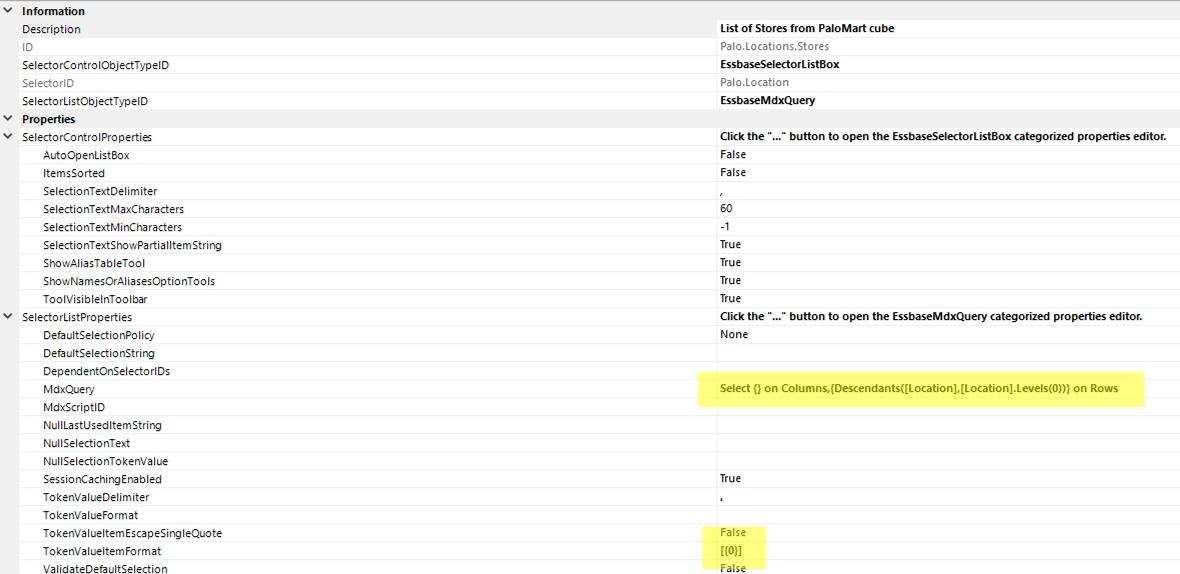
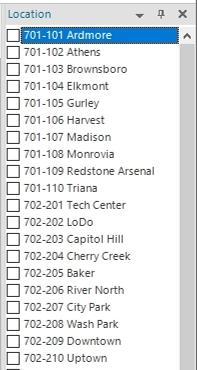
For the Locations list I use MDX to retrieve the list of stores. I also changed the TokenValueItemFormat to [{0}]. This will allow each value to be wrapped by square brackets for use in an MDX script.
image


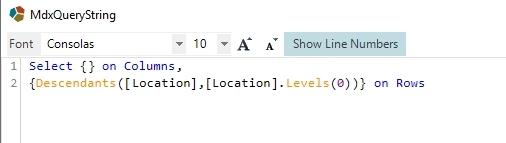
The store list MDX is shown here.
image


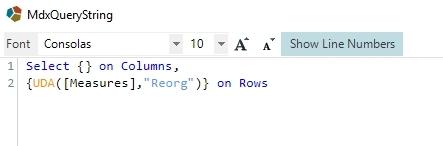
I use an outline UDA to create the list of Measures that the users may include in their report.
image


The Measures list MDX is shown here.
image


I used MDX to pull back the list of Years as well. All MDX, all the time...
image


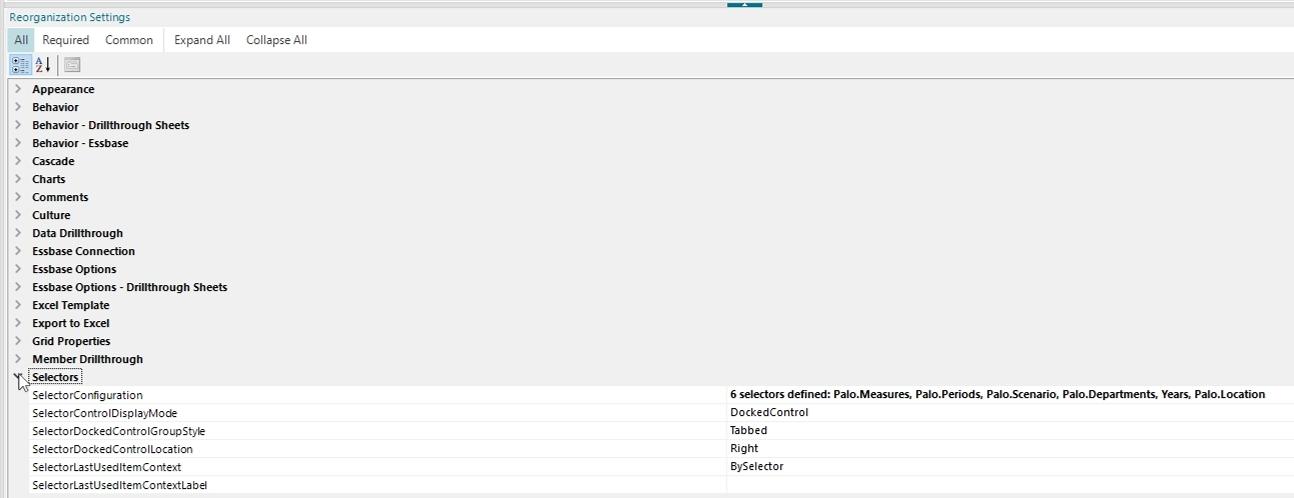
Next I configured my selectors in the Reorganization view properties.
image


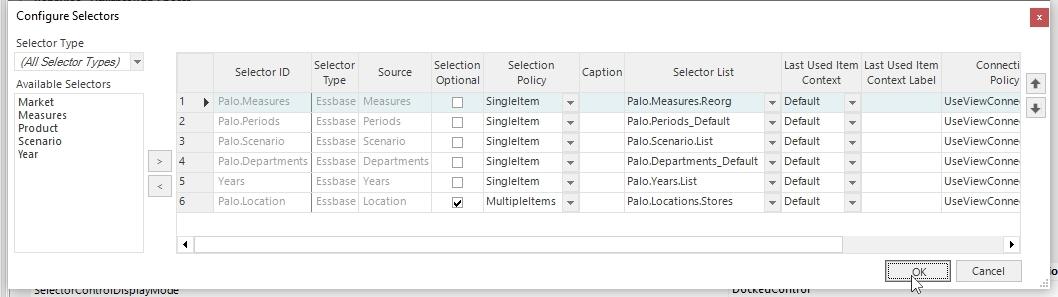
I added my Selectors and assigned them their appropriate Selector List. I set the Location selector as optional. I also set it to allow multiple selections.
image


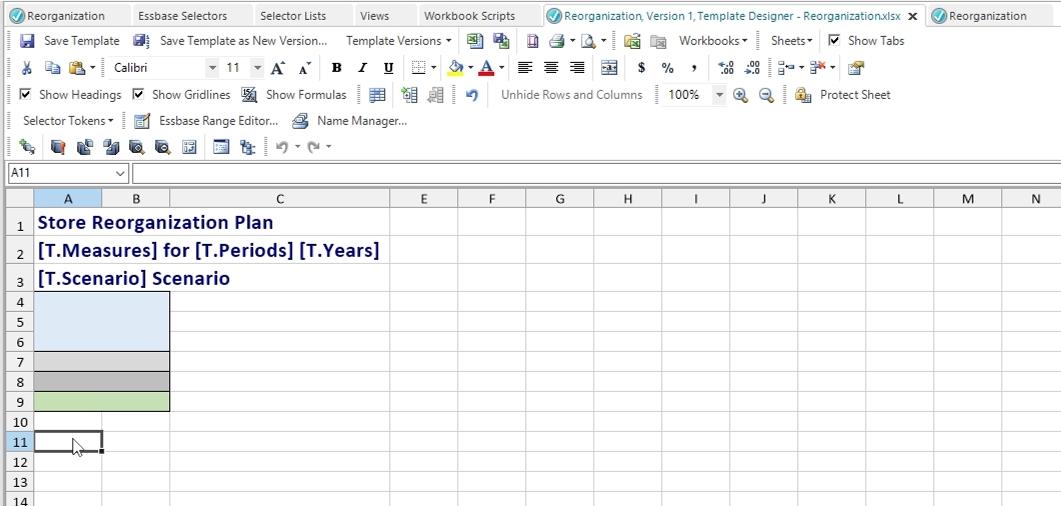
Then I created a very simple template. I included several tokens for a report heading and added a few formatted cells that I will use later to copy into the report.
image


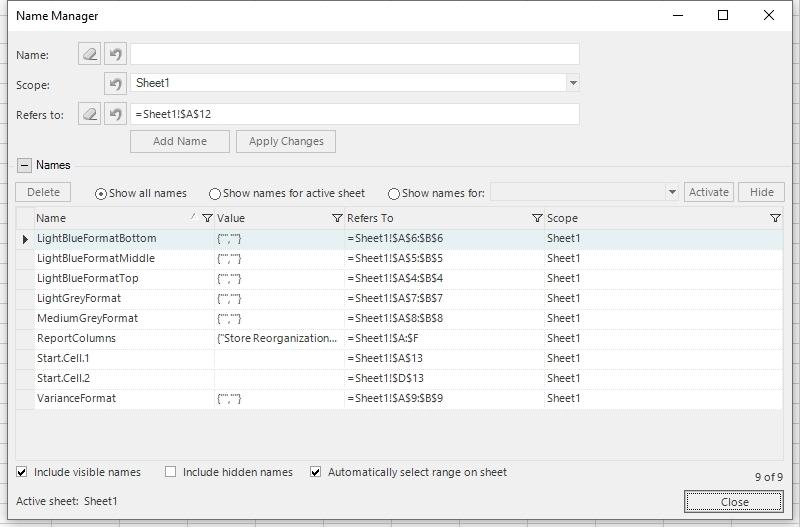
I set up Excel named ranges for the starts cells I will use to place data, formatted cells and the columns being used in the report.
image


Since there are no Essbase retrieval ranges in this report, the majority of the work will be done by the Workbook Script.
 
I first add the AfterWookbookOpen event and OnAfterWorkbookOpen Procedure.
 
image


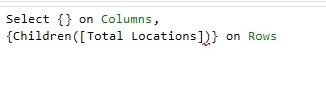
I then added a AddDataCache method. This method will run MDX to retrieve the list of divisions in my Essbase outline.
image
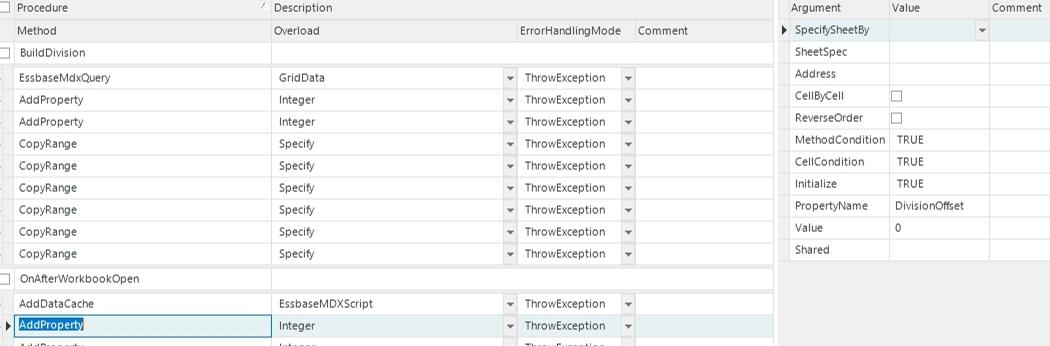
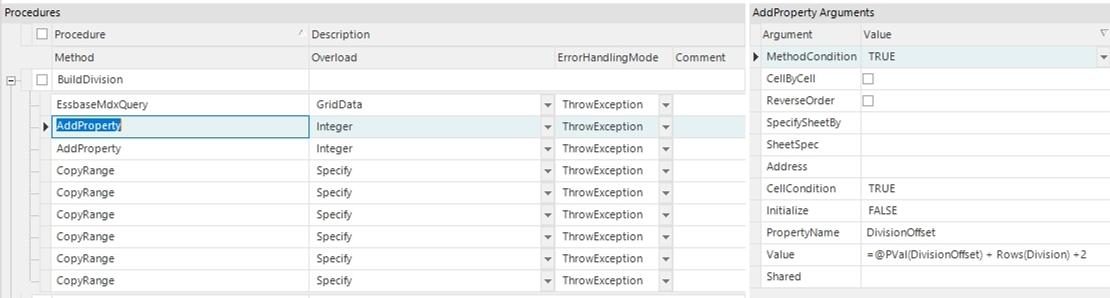
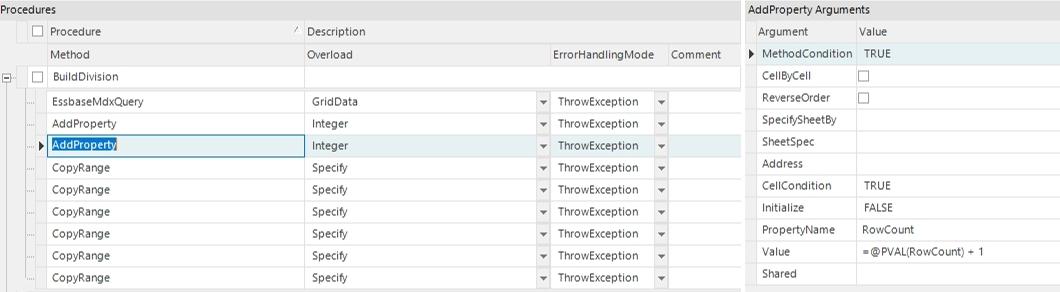
Next I added an AddProperty method to set a DivisionOffset property. This will act as a variable to keep track of where the latest division was added.
image


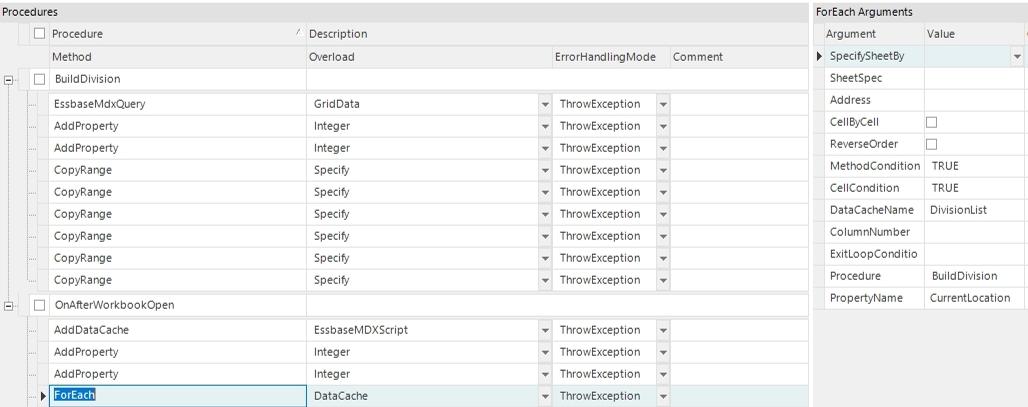
Now I created a ForEach method which will use the DivisionList DataCache from the earlier method. The BuildDivision procedure will be called for each Division in the list.
image


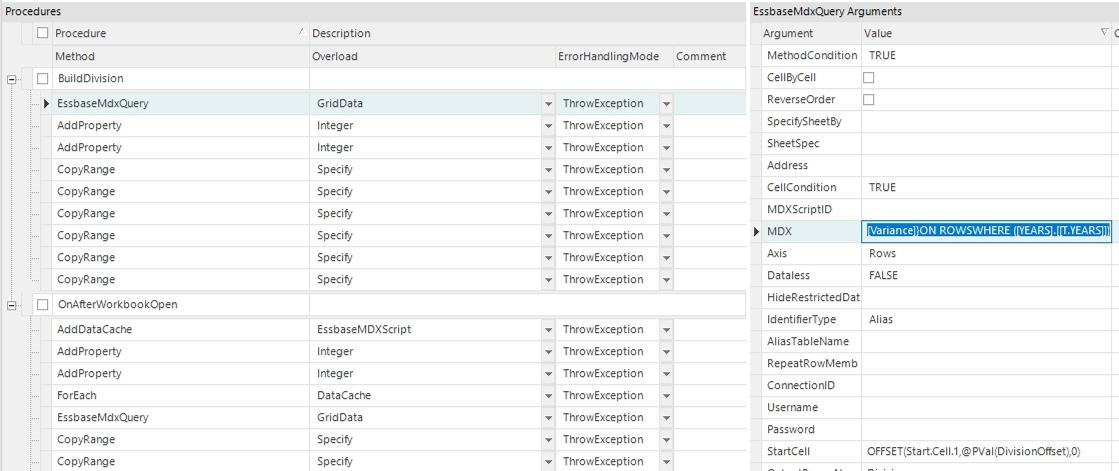
The BuildDivision Procedure starts out by running an MDX script.
image


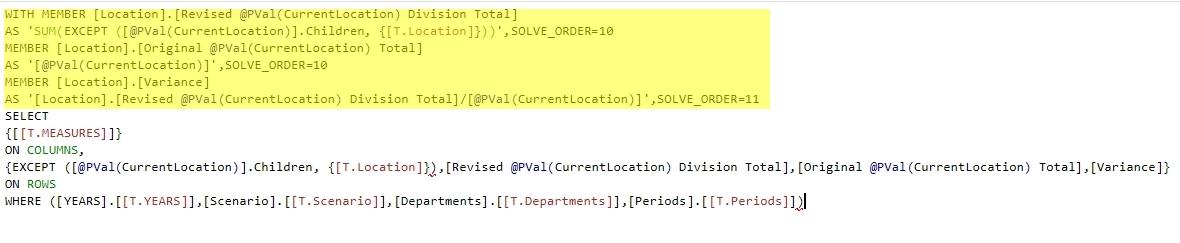
This script is how most of the data on the report will be created.
 
Notice the WITH MEMBER statements. These create members on the fly. In this case the measures will be dynamic based upon what the user selects. Locations selected by the user will be removed from the report.
image


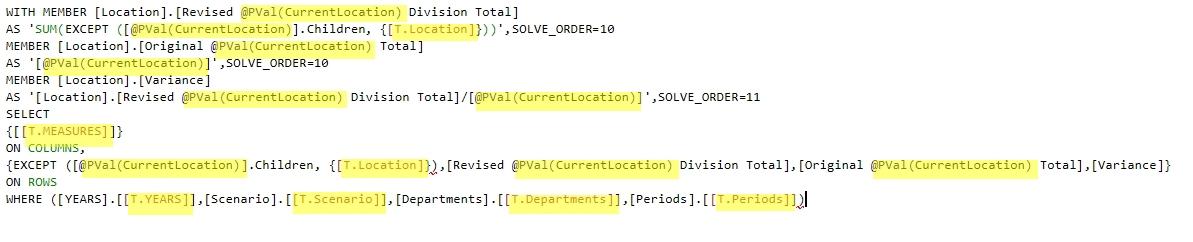
Tokens and the CurrentLocation property value will be automatically replaced by Dodeca at runtime.
image


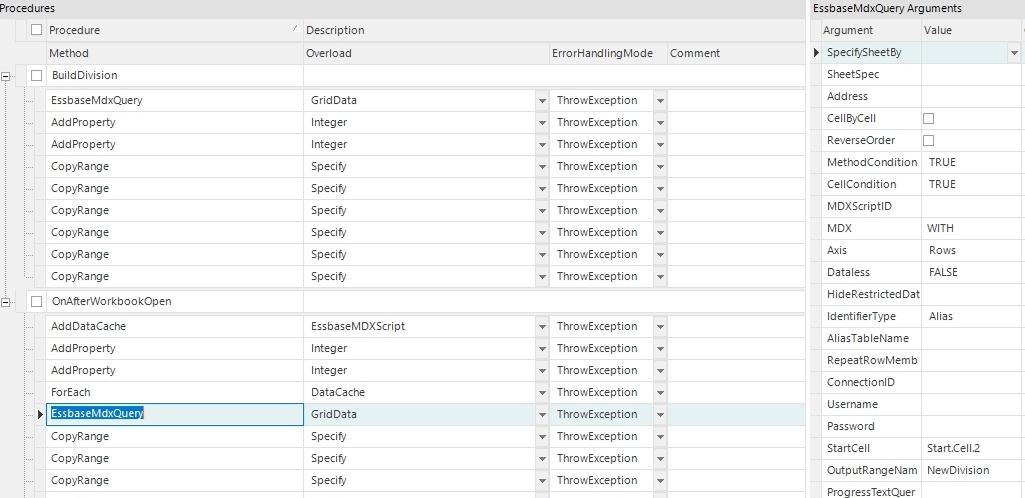
The DivisionOffset property will be adjusted based upon the size of the data returned in the MDX query.
image


The RowCount property will also be adjusted based upon the size of the data returned in the MDX query.
image


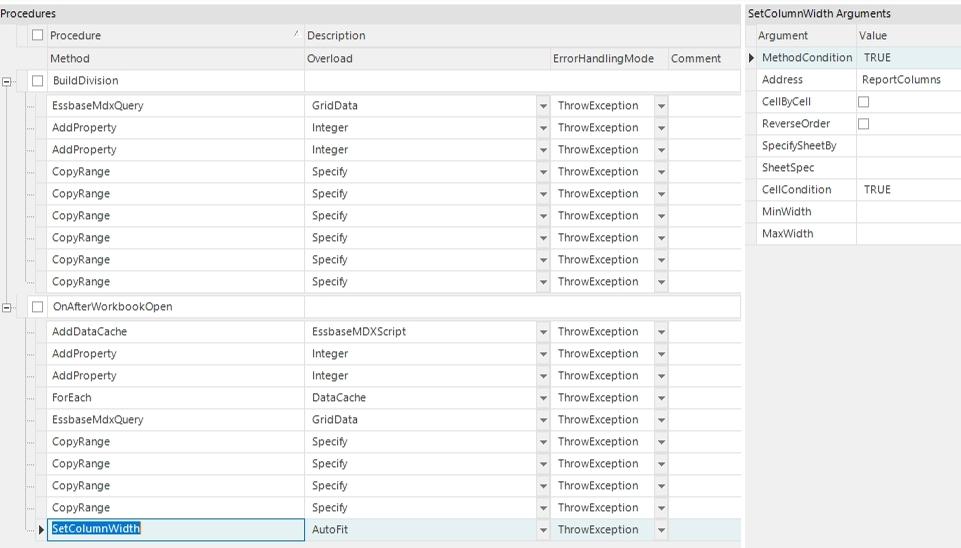
Next I added six CopyRange methods. These handle the copy of formatted cells in our hidden rows to the proper place on the sheet. I do this using the Excel Offset function and the property values I've been keeping track of.
image


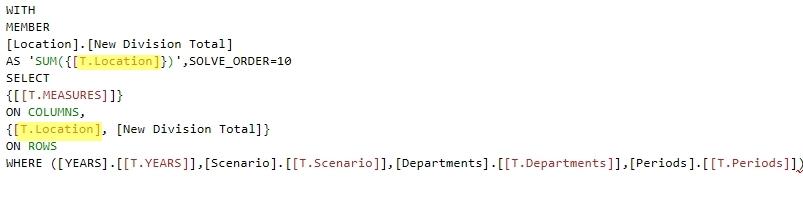
Once the BuildDivision procedure has been run for all of the divisions in our DataCache, we can then run the MDX Query for the new division.
image


This MDX script uses the WITH MEMBER statement along with Location tokens from the selector to pull in the locations for the new division and total.
image


Now that all the data has been retrieved on the sheet, I used the CopyRange method to format the data for the new division.
image


Finally, I set the Column Width on the sheet to AutoFit since there are no Essbase Retrieve Ranges to handle that for us.
image


By default, the report doesn't select any locations for the new division.
image


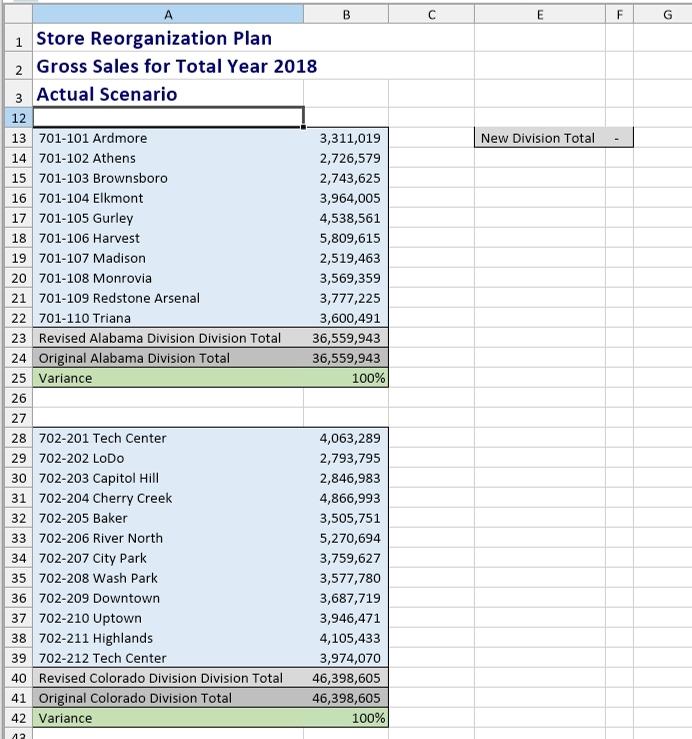
Once the report is run, the user can see the existing divisions with their changes as well the new division. This report can help a user quickly see the impact to changes in the organizational structure. This methodology could be implemented in a number of places to see the impact of changes before they happen.